The core setup
We open a short strangle — a short put and a short call, both around 30 delta, with 30 to 50 days to expiry on each leg. The exact delta shifts depending on implied volatility at the time. Lower IV means going slightly wider; higher IV tightens the strikes up.
Leaving this naked is perfectly valid if you have the capital. But in a trending market it becomes a catch-up game — you're constantly chasing price. We want to avoid that entirely.
Adding the second layer
Here's where the structure changes. We add a second short leg to both sides. Now we have two short contracts on each side of the strangle. But the critical move that makes this work is what comes next.
We also add a long straddle in a back calendar month — both legs at the money, around 150 to 190 days to expiry.
Why back month? The long legs are far out in time, at the money, and in a later expiry. This means they gain significant value when volatility spikes — exactly when the short legs are under pressure. Standard defined strangles buy protection tight and short-dated. That works against you. This structure works with you.
That long straddle provides defined protection to one of the short legs on each side. The other short leg remains essentially undefined — but the distance between the at-the-money long leg and the short strike creates a natural cushion. A buffer zone between where you sold and where it actually hurts.
How the position performs in movement
The front month short legs begin decaying immediately — and they decay fast. Especially on whichever side price is not testing.
If Tesla trends hard upward, the call side gets tested — but the put side decays aggressively. That rapid decay on the untested leg, combined with the increasing value of the long straddle, creates a position that performs better in movement than a plain short strangle ever could.
A standard defined strangle — where you buy protection tight on both sides — actually works against you in this scenario. Those long legs cost you premium and reduce your profit ceiling. In this structure the long legs are back month, at the money, and far in time. They gain value precisely when you need them.
What happens when IV spikes and price breaks through
This is where the structure earns its reputation.
If price reaches or breaks through a short strike and IV has spiked, you close the entire position. The volatility spike has inflated the long straddle value significantly. The short legs in trouble are offset by those long legs exploding in value. You close everything for a small momentary loss — or often close to breakeven.
Then you re-enter immediately. Re-centre the entire structure. Roll the short legs out to the next contract — 30 to 40 days to expiry — and now you're selling into elevated, juiced-up premium. The IV that just burned you is now working for you. You collect far more on the re-entry than the position you just closed.
The key insight: When price settles and implied volatility drops back — and it always does eventually — that elevated premium collapses. You sold it expensive. Now it's cheap. That difference is pure profit. The small loss on the close gets completely absorbed by the running gain on the new position.
Why this structure works across market conditions
This is the only structure worth running regularly regardless of what the market is doing — and here's why it handles every environment:
- Calm, sideways market: The front month shorts decay steadily into your pocket. Theta is your friend and nothing is testing your strikes.
- Volatile, trending market: The IV spike turns the long straddle into an accelerating asset. The untested side decays fast. The overall position performs better than naked, and far better than a standard defined strangle.
- Sharp spike and reversal: Close on the spike for near breakeven. Re-enter into elevated premium. Ride the IV crush back down for accelerated profit.
How to practice this before risking real capital
This structure has multiple moving pieces — two short legs on each side, a back-month long straddle, rolls on a spike, and re-entries into elevated IV. The only way to build real confidence in how it behaves is to run it yourself against historical price action.
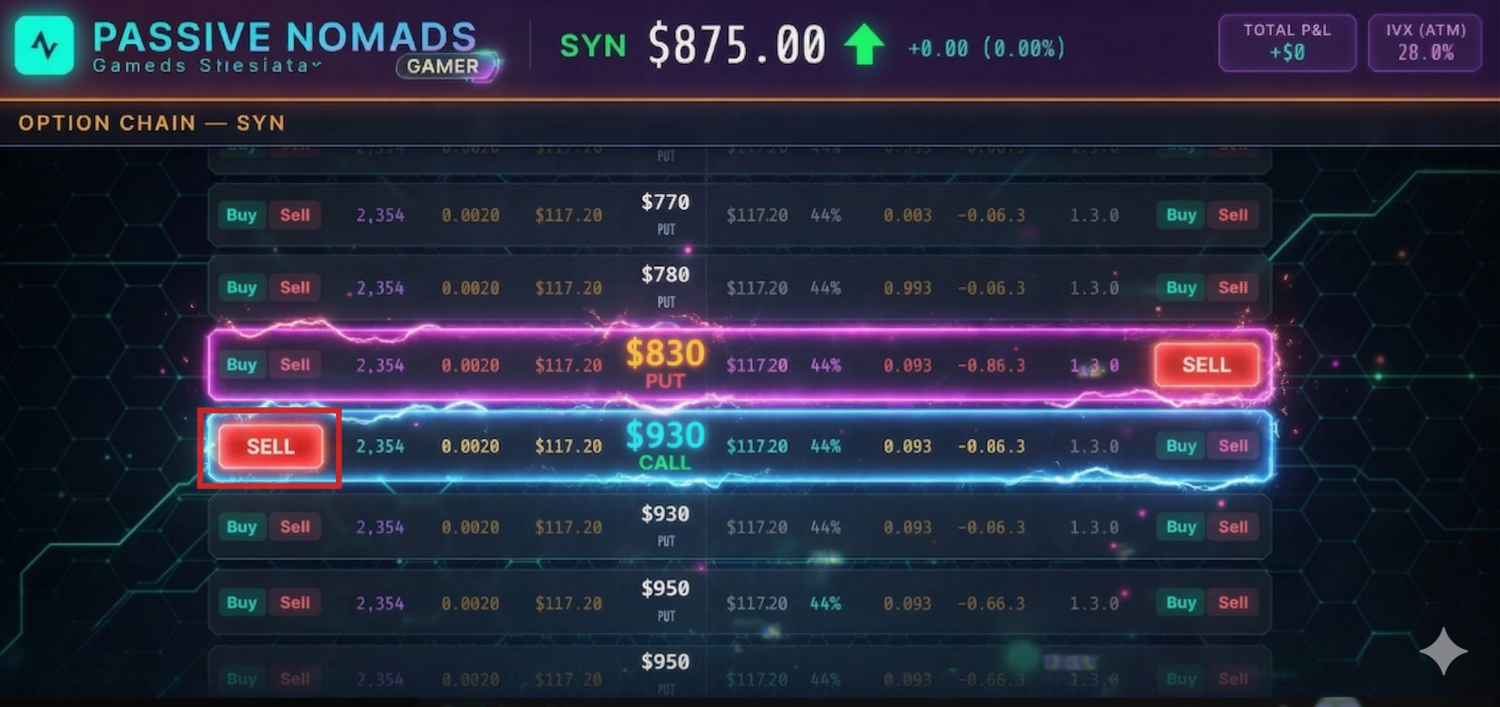
The Passive Nomads Options Simulator lets you do exactly that. Load Tesla's five years of historical data, build the full structure on the options chain, and watch how each leg decays, how the long straddle responds to IV spikes, and how the re-entry math actually plays out — before you ever risk a cent of real capital.
The simulator runs on a Black-Scholes 76 model, shows you real Greeks and extrinsic value on every position, and lets you step through days or jump forward in time on your own terms. You can ride out a full earnings spike and IV crush in one sitting — and know exactly what to expect when it happens live.